Part 1: Anatomy of an iQ Cheat Sheet
iQ Cheat Sheets (iQCS) are at the heart of Biotech iQ. Detailed information about each actively covered company can be found in the company's iQ Cheat Sheet, along with my interpretation, insights, and outlook. Small and mid-cap biotech companies can be very dynamic, with the thesis potentially strengthening or weakening with each press release; therefore, iQCSs are "living reports" and are regularly updated as new information becomes available. Subscribers are notified via email whenever a new iQ Cheat Sheet is published, or an existing iQ Cheat Sheet is updated.
The iQCS contains a lot of information and may seem overwhelming at first; however, as you become more familiar with the function and layout of each section of the report, I am confident the iQCS will become a valuable tool for evaluating the investment ideas presented here at Biotech iQ.
There's also no "right" or "wrong" way to use an iQ Cheat Sheet. Some investors might only read the first page, which provides a high-level synopsis of the company's investment thesis, strengths & weaknesses, potential risk-adjusted return, and near and long-term outlooks. Other investors may prefer to dive into each section of the report to obtain a deeper personal understanding of the story. I suggest spending some time with the iQCS for each company you find interesting and develop an approach that works best for you.
Much of the information in the iQCS is color-coded to quickly indicate whether the information is considered positive, neutral, negative, etc. The iQ Color Guide can be found on the first page of each iQCS:

Now, let's take a closer look at each section of the iQ Cheat Sheet in the paragraphs below. For this example, we'll be using the iQCS for Arcutis Biotherapeutics, which can be downloaded from the Cheat Sheets Section of this website.
Report Header

The Report Header identifies the Ticker, First Published date, and the date the report was Last Updated. Note that each report section displays the date that specific section was most recently updated. The Last Updated date shown in the report header refers to the most recent date that any section of the report was updated. Since information can change quickly, paying attention to the date each section of the iQCS was last updated is essential.
Company Profile
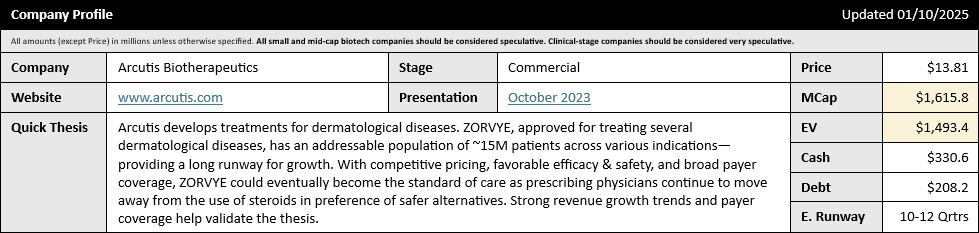
The Company Profile Section provides high-level details about the company and a Quick Thesis summarizing the investment thesis. Also included are links to the company's website and most recent Corporate Presentation, if available. Reviewing its website and Corporate Presentation is usually a good place to start when learning about a new company. This is often where I begin my research.
After familiarizing yourself with the company and its operations, reviewing the rest of the Company Profile and carefully considering the Quick Thesis is a good way to determine whether the story might interest you and be worth investigating further.
iQ Report Card
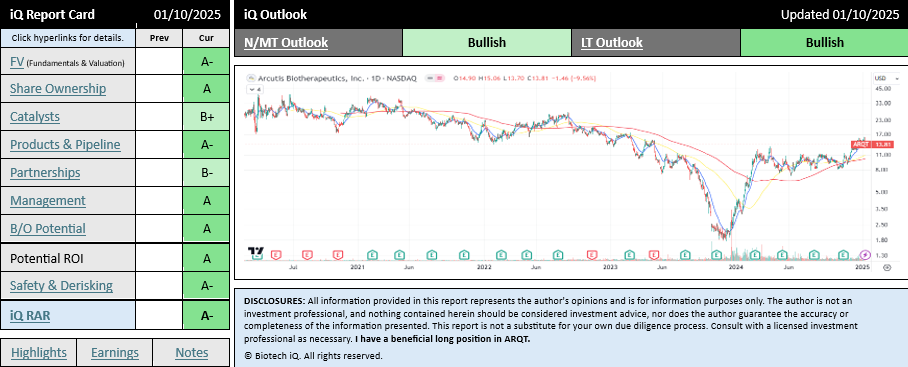
The iQ Report Card provides A through F scores across the 9 individual categories I use to evaluate each company. Higher scores are better, with an "A" being the best and an "F" being the worst. The consolidated iQ RAR, or Risk-Adjusted Return, is provided at the bottom. Note that iQ Scores can often change quickly since biotech companies tend to be very dynamic, with the story strengthening or weakening across multiple parameters as the story progresses.
Although a consolidated iQ RAR score is provided at the bottom of the Report Card, investors should also carefully evaluate each score across the nine categories individually. For example, an investor who places greater emphasis on a company's fundamentals may give more weight to the FV score. Alternatively, a more risk-averse investor may emphasize the Safety & Derisking score. No two investors are the same, which is why the iQ Report Card provides individual scores for each category, allowing investors to tailor their investing based on their specific criteria. Clicking on the hyperlinks next to each score will take you directly to the relevant section of the iQ Cheat Sheet for further investigation.
The N/MT Outlook and LT Outlook represent Biotech iQ's Near/Mid Term and Long-Term Outlook for the company. Please see the next section for more information.
Please click on the headings below for more information about each iQ Score.
Fundamentals & Valuation (FV)
The FV Score measures the company's fundamentals, financial strength, and valuation metrics such as market cap, enterprise value, cash runway, balance sheet, and revenue growth (for commercial-stage companies).
Share Ownership
Share Ownership measures the ownership structure for the company's equity. The most important factors here are typically the level of institutional and insider ownership and significant buying or selling activity, if any.
Catalysts
Catalysts measures the strength of upcoming catalysts. Catalysts can be very important as they often serve as inflection points for the share price.
Products & Pipeline
Products & Pipeline measures the strength of the company's products and pipeline, factoring in information such as clinical data, competitiveness, addressable market, and unmet need.
Partnerships
Partnerships measures the strength and value of the company's partnerships, if any. Partnerships can be very important, especially for small and mid-cap biotech companies, as they can be an important source of capital as well as help validate the company's science and pipeline--and often indicate industry interest.
Management
Management is one of the most challenging aspects of a company to measure, and it can take time to become familiar enough with a company's management to arrive at a good assessment. The Management score consolidates information across several qualitative metrics such as execution, balance sheet management, experience, etc. More detail on each of these metrics can be found in the Management section of the iQ Cheat Sheet.
Buyout (B/O) Potential
Buyout Potential measures the potential attractiveness of the company to a potential buyout partner by evaluating several metrics that can be found in the Buyout Potential Section of the iQ Cheat Sheet, including addressable market, intellectual property, platform technology, etc. The Buyout Potential Score should never be used as a predictor for buyouts--which are inherently unpredictable; however, it can be useful as a factor to be considered in determining the RAR.
Potential ROI
Potential ROI measures the long-term potential return on investment if the thesis continues to progress. At Biotech iQ I usually only focus on companies where I feel the long-term ROI is very favorable.
Safety & Derisking
Safety & Derisking measures the level of derisking demonstrated by the company. If an investment thesis continues to progress in the right direction, the level of derisking should continue to improve over time--although short-term events can sometimes increase risks. More cautious investors may typically want to avoid companies with lower S&D scores, whereas more aggressive investors may be willing to accept additional risk for stories they like.
iQ RAR
The iQ RAR Score is a consolidated score based on the individual scores across the preceding 9 categories. Information across each category is weighed qualitatively and quantitatively to arrive at an iQ RAR Score.
iQ Outlook
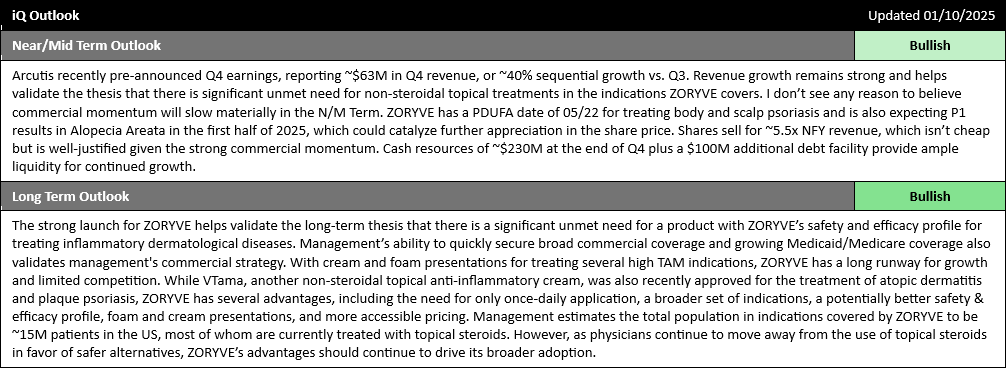
The iQ Outlook section displays Biotech iQ's general outlook over the Near/Mid Term and the Long Term. This information can help shape expectations over different timeframes, as well as help determine entry/exit timing. The Near/Mid Term can usually be thought of as the next six to twelve months, though this is only a general guideline--not a rule.
Highlights & Discussion
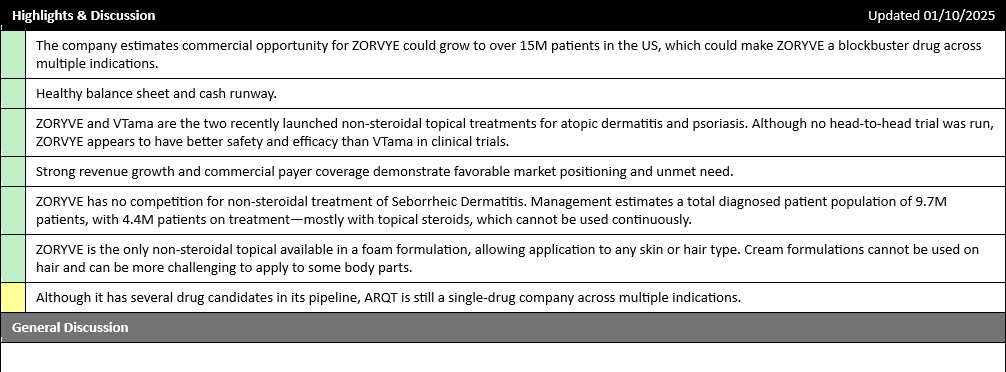
The Highlights & Discussion section identifies the story's key positive and negative aspects for quick reference. Sometimes, a more detailed discussion of the company and investment thesis may be provided in the General Discussion area if necessary.
Catalysts
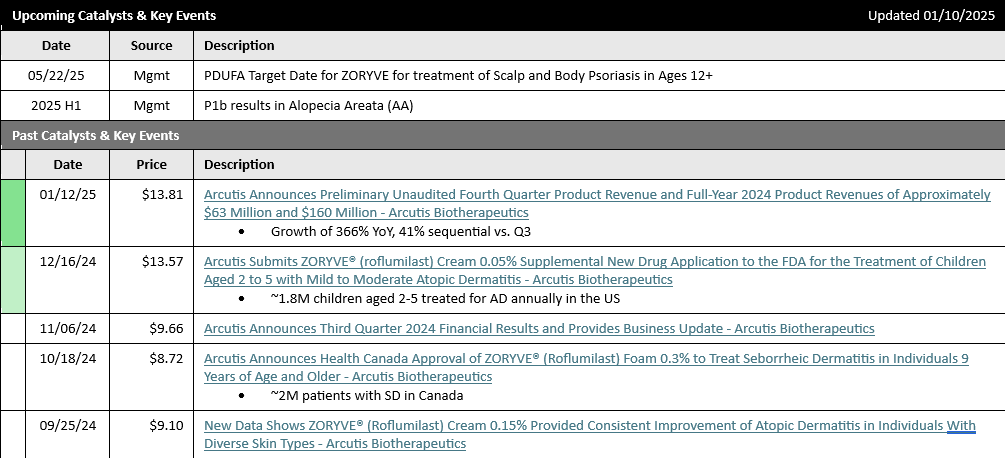
The Catalysts section lists upcoming and past catalysts and key events. Catalysts can serve as critical milestones and inflection points, especially for small and mid-cap biotech companies. The timing of catalysts can also be important in how the share price performs over time. If there are no upcoming catalysts, the share price may remain range-bound, or even fall, as investors choose to move funds to companies with more near-term catalysts. Upcoming catalysts, conversely, can often lead to improved share price momentum.
Share Ownership
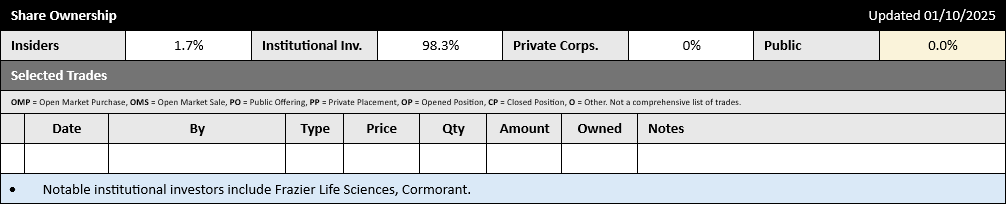
The Share Ownership section displays high-level ownership statistics for the company's equity. A high degree of insider ownership can demonstrate that insiders are aligned with shareholder interests, and a high level of institutional ownership can indicate positive interest by sophisticated institutional investors.
Fundamentals & Valuation
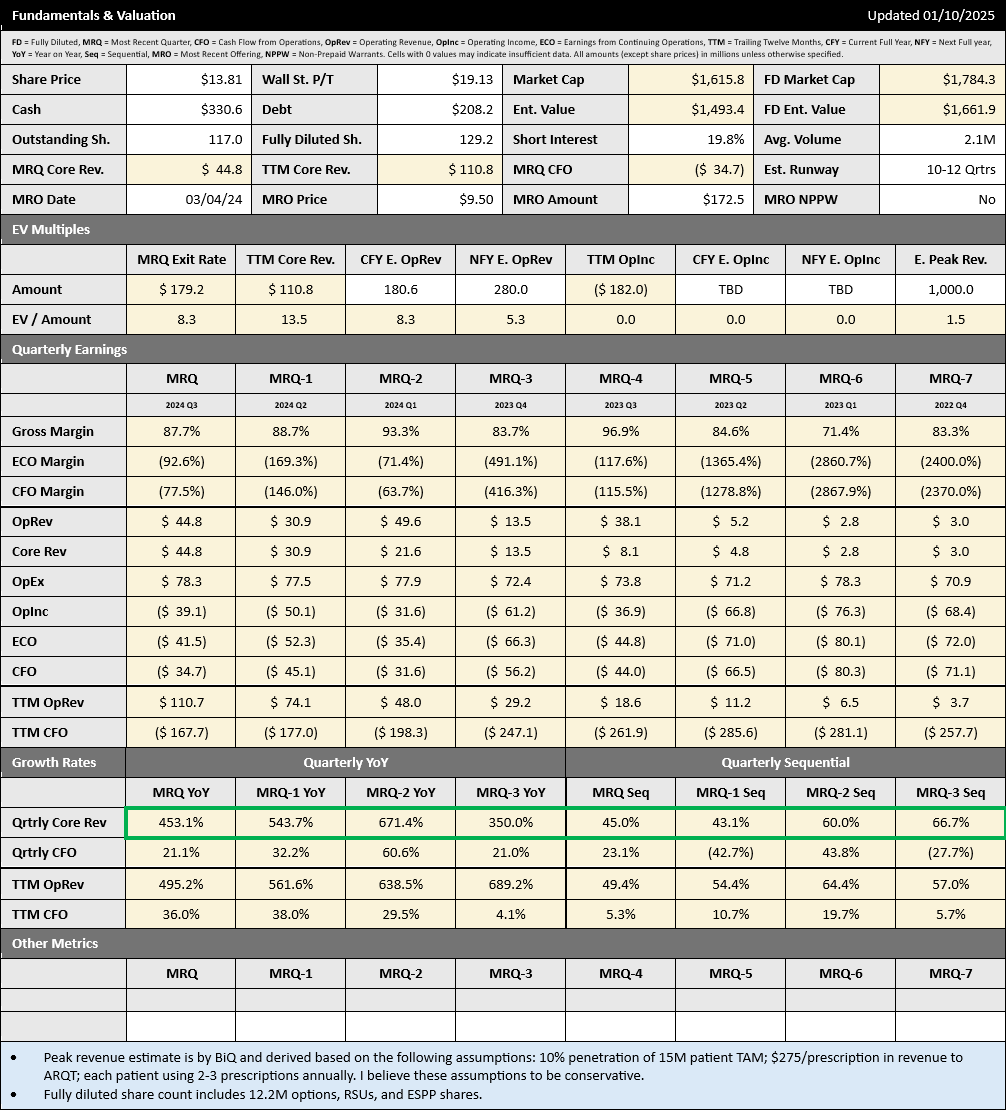
The Fundamentals & Valuation section provides insights into the company's balance sheet, cash flow, cash runway, valuation, and revenue growth metrics--which can be important for commercial-stage companies. Green or red boxes may often be used to highlight areas deserving of extra attention. Green boxes indicate positive trends, while red boxes can indicate negative trends. It can take time to become familiar with the various metrics presented in this section; however, learning to spot trends can help provide an edge when evaluating the financial health and prospects of a company.
Earnings History
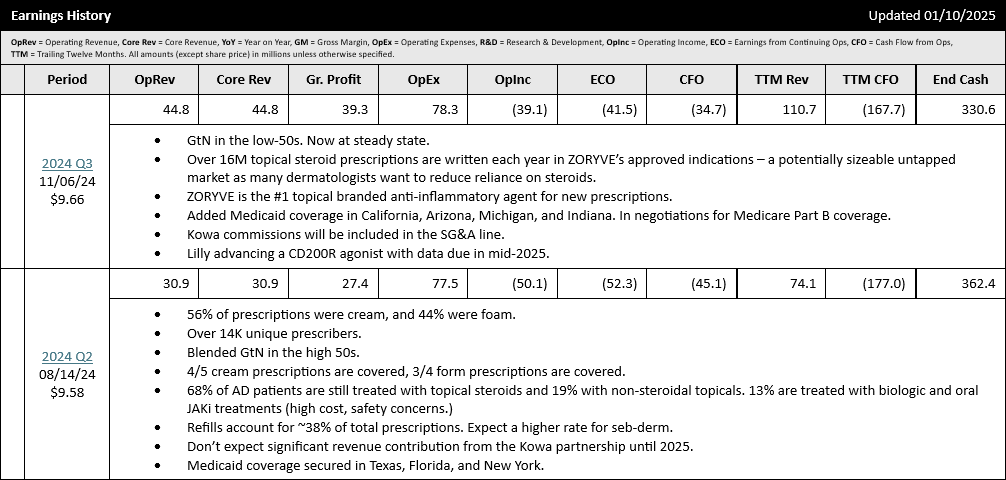
The Earnings History section displays quarterly earnings information from prior quarters and notes from the earnings release & management's comments. The basic earnings information is also consolidated into the Fundamentals & Valuation section (see above). The notes can provide essential insights and context and help investors better understand the quarter's results beyond just the top-line numbers.
Products & Pipeline
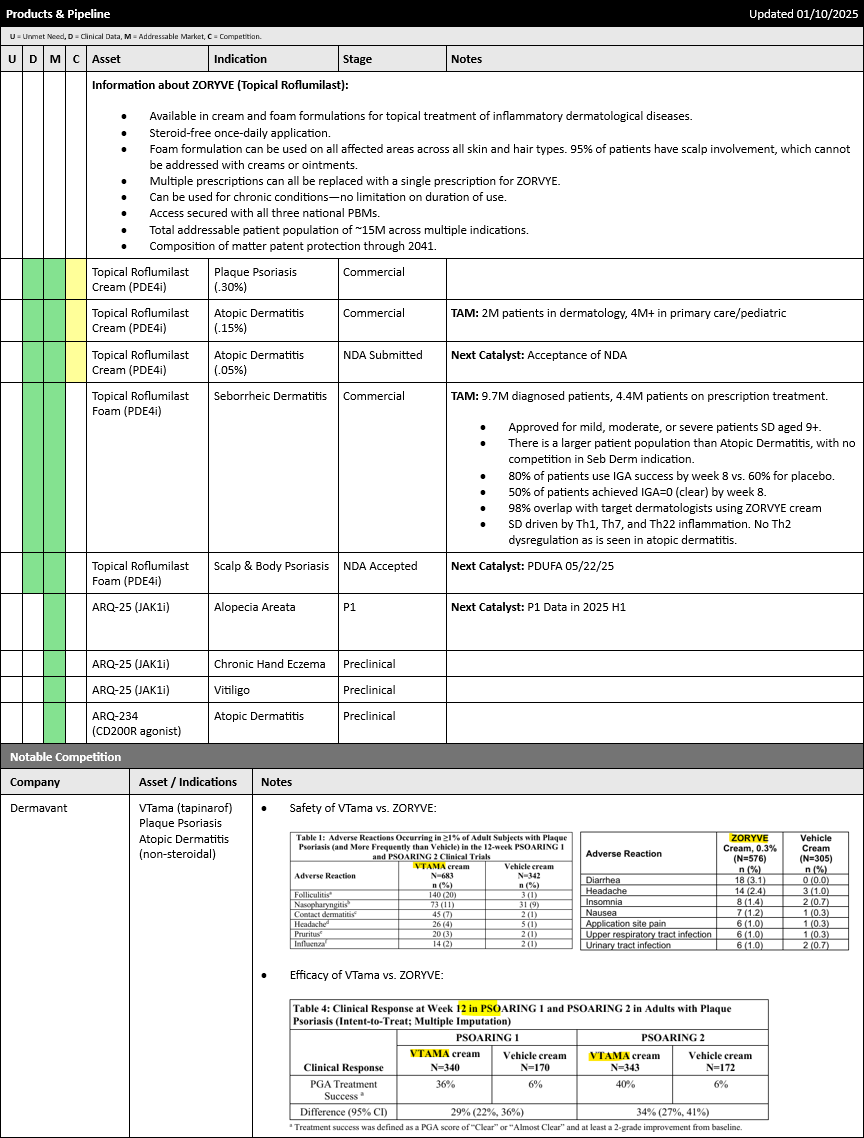
The Products & Pipeline section details the company's products, pipeline products, and potential competition. The colored boxes at the left can provide insight into important factors such as Unmet Need, strength of Clinical Data, Addressable Market, Competition, and IP. Understanding the strength of a company's products and pipeline can be essential for evaluating its prospects.
Partnerships
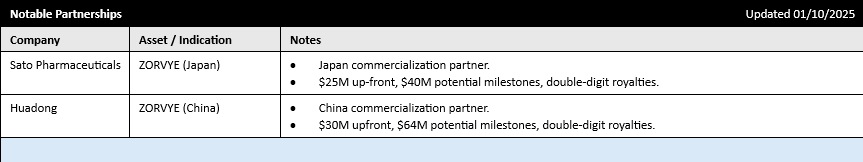
The Partnerships section details information about the company's partnerships, if any. Partnerships can be an essential source of capital and provide validation for the company's technology and products.
Management
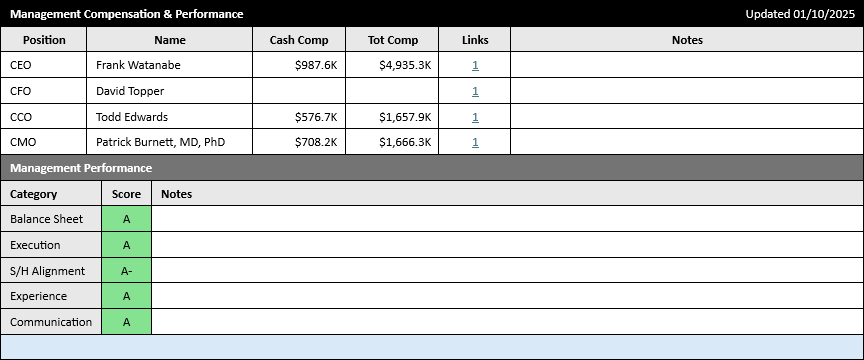
The Management section highlights key personnel and qualitatively assesses management's performance across 5 key performance categories.
Buyout Potential
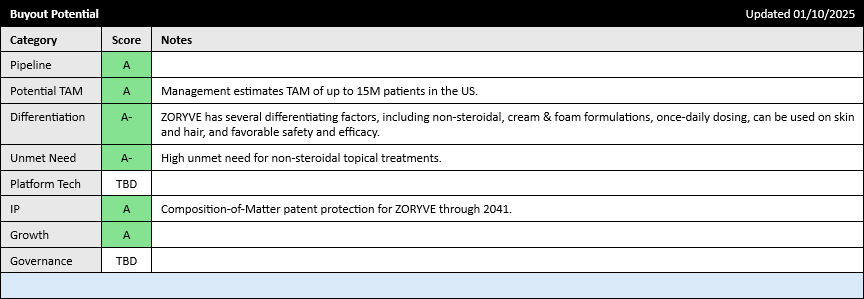
The Buyout Potential section assesses the company's attractiveness to a potential buyout partner based on 7 key categories. While it's impossible to predict a buyout, and the Buyout Potential should not be used as a predictor for a future buyout, Buyout Potential can still be an essential factor in how the market values the company. Companies with higher buyout potential are typically valued more highly than those with less.
Risk Factors
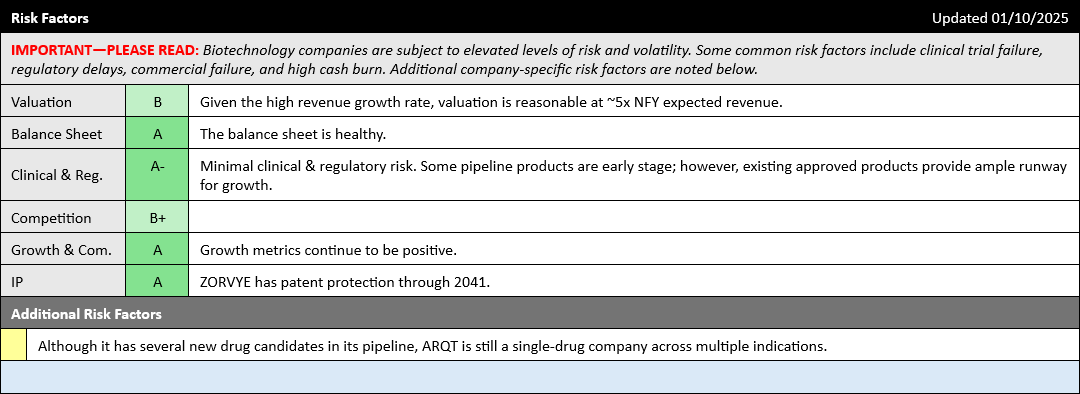
The Risk Factors Section measures common and company-specific risk factors. It's essential to carefully consider and feel comfortable with the risk profile of a biotech company before investing.
Notes

The Notes Section is a free-form area with general notes and updates that aren't explicitly related to other Sections of the iQ Cheat Sheet.
iQ RAR History

The iQ RAR History section tracks the evolution of the company's iQ RAR Score and iQ Outlook over time since the initiation of coverage.
Biotech iQ is not an investment professional, and nothing on this page or this website should be considered investment advice. Please consult with a licensed investment professional as necessary. Past performance is not indicative of future results.